 XI Wiki


How are you implementing this?
I tried to combine what you have said with Motenten's observation that values after 2.0 pDIF may be more common than those before it. This could be created by a slope decrease (from 1.1 to 1) around that point, as you are describing. It works on the excel version, but I cannot see how to implement it on my version because the slopes of crit min and max are non-parallel in either dimension (cRatio or pDIF).
I can get to something like this, which changes slope to 1, pretty easily with fairly superficial changes to my formula:
- Navigation
+ Reply to Thread
Results 41 to 60 of 172
Thread: pDif and damage


-
2012-01-13 10:21 #41
-
2012-01-13 14:57 #42CoP Dynamis
- Join Date
- Jul 2007
- Posts
- 281
- BG Level
- 4

Model I used had the slope from 0 to 0.49 at 9/8 (don't have enough data to say for certain what it is, but it's close to that, and would make very little difference even if slightly incorrect), 0.5 to 7.5 is stuck at 1.0 obviously, then from 0.76 to 1.75 I have the slope at 9/8. From 1.76 and up, it's ratio+3/8 (0.375 if you so prefer) up until you hit the 3.0 cap.
What I suggested previously was that the game generated a value between 0/256 and 192/256, and subtracted this from ratio, using that number to pull the actual pDIF from the function above. Finding the average after that should be simple enough.
Edit: upon rereading, I'm not sure this really answers your question, since I'm not sure I understand which part you are trying to ask about. I can provide more clarification if needed.
-
2012-01-13 15:28 #43
That is approximately what I was doing in the code above, I think. Toss it in to a single piecewise equation and get numbers out.
Do you have intercepts for those values lines?
If I plot what you just said (without a randomizer), I get this:
That's:
Did you mean to add something to the equations like an intercept? It's pretty obvious that .5*9/8 is not going to be continuous with 1. I've tried to do this though, and I can't get the max and the min both happy at the same time.Code:clear; cRatio=[0:.01:3]; % Make an array of numbers from 0 to 3 counting by 0.01s. reso = length(cRatio); % How long is the array? bigar = zeros(10000,reso); % This is just for lag, although it isn't really necessary here because the array size never changes. Habit. for index=1:reso % This index variable is for counting through the elements of cRatio randy = cRatio(index) - rand(10000,1)*3/4; % Makes a 10000 element array of cRatios below the current cRatio with varying 0~3/4 offsets. for n = 1:10000 if randy(n) <= .5 bigar(n,index) = 9*randy(n)/8; % Equation Below 0.5 else if randy(n) <= .75 bigar(n,index) = 1; % Equation between .5 and .75 else if randy(n) <= 1.75 bigar(n,index) = 9*randy(n)/8; % Equation between .75 and 1.75 else bigar(n,index) = randy(n)+.375; % Equation between 1.75 and 3.0 end end end % These next two steps just apply the floor and ceiling. if bigar(n,index) < 0 bigar(n,index) = 0; end if bigar(n,index) > 3 bigar(n,index) = 3; end end end % If I wanted to add a randomizer, I could add it here. plotar = zeros(3,reso); plotar(1,1:reso) = cRatio; %Cratio! plotar(2,1:reso) = min(bigar); %Grab the min values plotar(3,1:reso) = max(bigar); %Grab the max values figure; plot(cRatio,plotar(2,:)); hold on; plot(cRatio,plotar(3,:)); % Plot the mins, then plot the maxes both against cRatio.
-
2012-01-13 15:48 #44CoP Dynamis
- Join Date
- Jul 2007
- Posts
- 281
- BG Level
- 4
Ah, right, the model I used simply started from the 1.0 cap and generated a line backwards along 9/8.
As I lack good data for that range, it's a bit of a guess still, but based on what I do have, and extrapolating from that, intercepts should happen at ~-0.445 for min and ~0.421 for max (edited out old numbers due to stupidity, shouldn't be doing this at work...), which is slightly different from the 9/8 figure (closer to 37/32, in fact ).
-
2012-01-13 16:19 #45
Okay, well I'll let you think about it and model it. The min and the max should have the same equation if they're generated from the same piecewise function though, right?
Nevermind, I got it to work. There was a second offset. At the moment I'm using:
cRatio < -0.4 : 0
cRatio < .5 : 9/8*cRatio+.45
cRatio < .75 : 1
cRatio < 1.75 : 9/8*cRatio+(1-27/32)
cRatio < 3 : cRatio + .375
cRatio > 3 : 3
The frequency distribution also works out. I have not checked this against the data and do not intend to. Feel free to provide the correct constants!
Does anyone see a feature of the graph that this fails to model with the constraints:
* Critical Hits add 1 to cRatio
* 1H Ratio input caps at 2
* 2H Ratio input caps at 2.25
* The output caps are as stated above.
-
2012-01-13 16:31 #46CoP Dynamis
- Join Date
- Jul 2007
- Posts
- 281
- BG Level
- 4
That would be correct, yes. I can't give any better numbers due to a lack of data that low though, 37/32 is simply what fits best. Numbers for 0.5 ratio and above should be accurate, however.
-
2012-01-14 11:15 #47MasamuneGuest
A fast verification would be:
- set Ratio=1: is frequency spike corresponding to DMG=BaseDMG AND centered through the whole dmg values range ?
- set ratio=1.4 : is spike completely on the left of dmg range ?
- set ratio=0.4 : is spike completely on the right of dmg range ?
- compare spikes intensity between Ratio=1,7 and Ratio = 5: the former is much less noticeable than the latter.
Also, i'mnot sure if i misread but both Rena and Byrth seems to think Crits caps @ Ratio=1.75 ? it's actually 1.65.
Another thing is crits=Norm +1.2 (and not +1), because if yu just +1, just take the case where all randomizers rolls lowest (ie 0) yu end up with a critmin = Normmax, while parses show clearly a gap between normal maxs and crit mins. Unless your formulas takes care already of an additional term to produce that gap ?
I have a question about the range 0.3 < cRatio < 0.6 : do we have proof crits distribution actually go "eat" inside normal hits distribution ?
-
2012-01-14 17:38 #48CoP Dynamis
- Join Date
- Jul 2007
- Posts
- 281
- BG Level
- 4
You misread; according to the proposed theory, they would start happening at 1.625, albeit very rarely. I can confirm they start happening at least at 1.63 ratio.Also, i'mnot sure if i misread but both Rena and Byrth seems to think Crits caps @ Ratio=1.75 ? it's actually 1.65.
It accounts for this. The randomizer would never subtract more than 0.75, and crits would add 1.0, so crits would be at least 0.25 ratio over the max for normal hits. (At cap, minimum crit pDIF with this formula would result in 2.625 for one-handers, and 2.875 for two-handers.)Another thing is crits=Norm +1.2 (and not +1), because if yu just +1, just take the case where all randomizers rolls lowest (ie 0) yu end up with a critmin = Normmax, while parses show clearly a gap between normal maxs and crit mins. Unless your formulas takes care already of an additional term to produce that gap ?
Not sure I understand this correct, but are you asking if crits for low ratio fit the expected numbers for non-crits 1.0 ratio above? If so, yes, according to my data they fit, though some may be a few points off (but still within range). This can easily be explained by limited sample sizes.I have a question about the range 0.3 < cRatio < 0.6 : do we have proof crits distribution actually go "eat" inside normal hits distribution ?
-
2012-01-14 17:59 #49Custom Title
- Join Date
- Nov 2008
- Posts
- 1,066
- BG Level
- 6
- FFXI Server
- Diabolos
 My system pegs it at 1.6363~, or 18/11, so definitely agrees with this assertion. Maybe you should give it another look.
 Originally Posted by Rena

I've got +1.0 on crits too, but also narrows the range of Primary because a straight +1.0 ranges too low at high cRatio.
Or we can keep playing this game where you guys are ignoring my formula and still catching up on how to produce the 1.0 spike just because some few of you rightfully think I'm a self-aggrandizing douchenugget.
-
2012-01-14 18:16 #50CoP Dynamis
- Join Date
- Jul 2007
- Posts
- 281
- BG Level
- 4
One particular instance has it happening at 393/241 = ~1.6307 ratio, so less than your assertion. Furthermore, suggesting we shouldn't explore other ideas just because you propose another, unproven, theory is asinine. You do not have the amount of evidence necessary for me at least to disregard other possible solutions.
Suggesting we are 'still catching up' with reproducing the 1.0 caps and floors is funny though, since I came up with an idea to solve it in the very posts where I posted the information about where they occur for max normal/min crit pDIF. A solution was already proposed in this post, before you posted that you had a solution. Develop your formula as you wish, but please stop attacking those of others.
And again, to repeat what I said in a previous thread, it has nothing to do with any particular feelings about you, so let me ask you again: drop the persecution complex.
-
2012-01-14 18:57 #51Custom Title
- Join Date
- Nov 2008
- Posts
- 1,066
- BG Level
- 6
- FFXI Server
- Diabolos
The problem is you're allegedly sitting on the data that makes or breaks my system, so we can all keep Princessing about over it or you can put up or shut up about it being 'unproven' when I show it fitting Masa's >1.0 cRatio data like a glove.
Once again vague data. You can hit above a 3.0 post-Secondary in my system as early as 1.506 (116/77) cRatio, just at extremely low probability because it's Secondary pushing sub-3.0s over, so your assessment is false. I did misstate: Pre-Secondary capped 3.0s start at 1.6363~, so that's roughly the earliest you could see a nigh 3.15 'high Secondary' crit. Originally Posted by Rena
But this is exactly what I want. Tell me what the hell doesn't fit since apparently you're the paragon of coughing up such data.
-
2012-01-14 20:16 #52CoP Dynamis
- Join Date
- Jul 2007
- Posts
- 281
- BG Level
- 4
Sitting on data that breaks your system means we should ignore my new proposed one in favor of yours that cannot explain available data? Not quite buying that line of reasoning.
And that datapoint was indeed 3.15 pDIF. That I happened to have exactly such a datapoint is not as coincidental as you would think, as I specifically went out to see if I could produce results as would be expected from my proposed formula, which would mean a 3.15 crit at 1.625 ratio. With the highest level of lesser colibri's defense of 241, this would mean 1.625*241 = 391.625 rounded up = 392/241 = 1.626556~ ratio in order to produce a 3.15 crit. Since this would be quite rare, and I was somewhat low on time, and because I should probably find a mob with a defense rating more suited to producing an exact 1.625 ratio (see previously mentioned time constraints), I decided to try at 393/241 ratio instead for the time being, and attempt to produce better evidence for the 1.625 cap at a later time.
If you don't believe me, you're perfectly free to go reproduce the test yourself. 20 D weapon including fSTR, 63 damage was the result. Attack, defense and target noted above. Took about 14 kills to see it, if that is of interest.
-
2012-01-14 21:52 #53Chram
- Join Date
- Sep 2007
- Posts
- 2,526
- BG Level
- 7
- FFXI Server
- Fenrir
Wanted to re-do my dhalmel test to check something regarding the distribution. I'm still looking over the distribution effects, but decided to use this for another check against the formulas being proposed.
Base damage: d42 (31 + 11 fStr)
Att: 551
Mob level is around 40, so should be far past cRatio cap. Previous test was also at cRatio cap.
Sample size (non-crit):
Original: 1382
New: 1395 (so far)
Total: 2777
Min Damage: 65 (pDif between 1.54762 and 1.57142) 3 occurrences
Max Damage: 103 (pDif between 2.4524 and 2.4761) 15 occurrences
Predictions:
Mote:
Minimum: 2.0 * (1+152/1024) - 752/1024 = 2.0 - 448/1024 = 1.5625. Match
Maximum: 2 + (capped) 400/1024 = 2.390625 * 1.05 = 2.51015625. Within scope, but not a match.
Max damage: 42 * 2.51015625 = 105.4265625
Rae:
Minimum: 2.0 - 0.55-(cRatio-1)/10 = 2.0 - 0.45 = 1.55. Match, but should result in higher frequency that Mote's.
Maximum: 2.0 + 0.30+(cRatio-1)/10 = 2.4 * 1.05 = 2.52. Within scope, but not a match.
Max damage: 42 * 2.52 = 105.84
Working through the probabilities, tried to figure out frequency of lowest damage value for each formulation. Expected frequency with 2777 hits:
Mote: 1.7
Rae: 9.7
With 3 observed samples, confidence interval is between 0.0002 (0.6 occurrences) and 0.0033 (9.2 occurrences). Raelia's formula therefore appears to be outside the confidence interval, though rounding effects due to integer math make that less certain.
Both formulas yield a max possible damage value of 105, whereas max observed was 103. The probability of -not- getting at least a 104 in 2777 hits is:
Mote: 1.9 * 10^-7 (pretty much impossible)
Rae: 1.4 * 10^-11 (pretty much impossible)
Given this consideration, I looked back at my formula. I changed it recently from capping at 384/1024 to capping at 400/1024 due to the probability issues that Rae brought up. If I drop it back to 384/1024...
Max damage: 42 * 2.375 * 1.05 = 104.7375
Probability of not hitting 104: 1.6% (still quite unlikely to not get a 104)
Masa's Woodville data prevent the primary modifier max from dropping much below this. A max of 147 on d59 means a minimum pDif of 2.4915. Factoring out 1.05 means max primary pDif has to be *at least* 2.373.
However there was one additional factor that was dropped in the process of accepting certain assertions in the recent discussions. Originally I floored the damage value before applying the secondary modifier. If I did that now:
With 400/1024 cap:
42 * 2.390625 = 100.40625 floored to 100. Should still see 104+.
With 384/1024 cap:
42 * 2.375 = 99.75 floored to 99. 99 * 1.05 = 103.95. Would never see 104.
How would that work on Masa's data? 59 * 2.375 = 140.125, floored to 140. 140 * 1.05 = 147.000. So it's -possible-, but seems unlikely given that 147 seemed fairly easy to hit, but the probabilities would imply it would occur about once in ~19,000 tries. Actual occurrence was 3 in 2170 hits.
I'm trying to work out if there's any way to determine whether or not the primary damage value is calculated and floored before the secondary multiplier is applied. I have a vague idea, but it's going to be difficult to test.
-
2012-01-14 23:09 #54Chram
- Join Date
- Sep 2007
- Posts
- 2,526
- BG Level
- 7
- FFXI Server
- Fenrir
Planned test:
Base damage: 61 (H2H d53 (455 skill) + 8 fStr (+0 weapon, no +kick damage)
455+ skill: 424 base, 16 merits, 15 in gear. 7 hands, 7 neck, 3 ear
Target: Lesser colibri.
Cap fStr at +28 dStr. Vit of 55 (max) means fStr capped at 83 str or higher.
Cap attack at 482 att or higher, which only requires 17 att in gear.
Gear set:
Ursine Claws//Thew
Tantra+2/Faith/Brutal/Bruiser
Tantra+2/Tantra+2/Rajas/Epona
Atheling/Twilight/Tantra+2/Usukane
For max DA/TA/KA rates and 25% haste. Want at least 3000 non-crit hits. Should take about 2 hours (including time running between mobs).
Edit: Forgot to factor in the delay reduction on Tantra+2 body. It nets a slightly lower average delay per swing than Aurore. However I also found that going bare-handed completely trumps it; average delay per swing is a good 10% lower than using Ursine Claws (based on an estimated OAx distribution), so I'll just do that instead.
Anticipated values:
If capped at +384/1024 (0.375), max primary is 144.875
If floored, max is 151.2
If not floored, max is 152.119
If capped at +400/1024 (0.390), max primary is 145.828
If floored, max is 152.25
If not floored, max is 153.120
If capped at 2.4, max primary is 146.4
If floored, max is 153.3
If not floored, max is 153.72
So:
If max damage seen hits 153, cap is either 2.4, or 2.39 with non-floored primary.
If max damage seen hits 152, cap is not a floored 2.375.
If max damage seen is 151, cap is probably a floored 2.375.
Further refinements will be made after any exclusions are completed.
-
2012-01-15 01:22 #55Custom Title
- Join Date
- Nov 2008
- Posts
- 1,066
- BG Level
- 6
- FFXI Server
- Diabolos
Simulated 50k hits with histogram. Floored Primary eliminated all 104 damage hits, but increased the expectation of 65 damage hits from 9.8 (you came in a bit low) in 2777 to 22.2.
However it also cut the occurrence of 103 damage hits to just 11.66 in 2777, down from 34.5 and a fair rate of 105 damage hits, bringing such into range. I think Secondary is too finely distributed (at least 16 steps, likely more than 32 steps) to see a flooring step before it except at an extremely low base damage, like a 1 damage one-handed weapon for 9 base damage that with capped Ratio should produce around 21.6 at capped Primary and well into 22 with a decent Secondary, but if Primary is floored first the margin for a 22 would be next to nothing. I'm sure a certain somebody just happens to have a 9 base damage sample floating about.
Rena's datapoint only contends the critical hit modifier I came up with just yesterday, so I'm not concerned with it just yet but I'm happy to have it. Moten's last post may yet tweak my normal Primary which changes the baseline of that crit mod anyway.
-
2012-01-15 14:30 #56CoP Dynamis
- Join Date
- Jul 2007
- Posts
- 281
- BG Level
- 4
I do actually, thanks for asking. My notes show that the maximum normal hit for a 9 D weapon does indeed equal 22, but this doesn't tell us much, since even with flooring, such a number is possible. You'd be better off asking about the D values for which a lack of flooring would result in a higher value than would be possible with flooring, such as 5, 7, or perhaps 15 D. Looking at my notes for those, all of the results match up with what would be expected if you include flooring.
Considering potentially inadequate sample sizes and such however, I went out and gathered up another few samples with a 15 damage weapon. 2.2k of them, to be specific. With a max pDIF of 2.375, we get 15*2.375*1.05 = 37.40625 for expected maximum value. If we include flooring, we get floor(15*2.375)*1.05 = 36.75. The result? Not a single 37 damage hit, which would be an indication that there is indeed flooring between the two steps. Of course it's impossible to completely rule out bad luck, and I might expand on the sample size later, but for now, these results are what I have.
On another note, I managed to produce a 3.15 crit at exactly 1.625 ratio. I also tried at 1.6245~ ratio, but no 3.15 crit was seen.
-
2012-01-15 16:37 #57Chram
- Join Date
- Sep 2007
- Posts
- 2,526
- BG Level
- 7
- FFXI Server
- Fenrir
Confirming config
Gear set:
None//Thew
Tantra+2/Faith/Brutal/Bruiser
Tantra+2/Tantra+2/Rajas/Epona
Atheling/Twilight/Tantra+2/Usukane
Str: 93+26 = 119 (capped)
Att: 584 (capped)
Skill: 457 (53 base damage)
Got assistance from a friend, who came brd/whm for Haste and Marches to make things go faster. No spellcast. No gear changes except manually swapping to Hermes Sandals for running back to the start of the loop.
Hit/miss: 3964/194
Crits: 928
Non-crits = 3964 - 928 = 3036
Distribution, for reference:
Spoiler: show
We see that, while 151 is relatively common (almost as many as 150), there were absolutely no instances of 152 or higher.
Probabilities:
If capped at +384/1024 (0.375), max primary is 144.875
If floored, max is 151.2
If not floored, max is 152.119
Probability of not seeing 152 in 3036 hits if not floored: 94.5%
If capped at +400/1024 (0.391), max primary is 145.828
If floored, max is 152.25
If not floored, max is 153.120
Probability of not seeing 152 in 3036 hits if floored: 42.4%
Probability of not seeing 152 in 3036 hits if not floored: 0.73%
If capped at 2.4, max primary is 146.4
If floored, max is 153.3
If not floored, max is 153.72
Probability of not seeing 152+ in 3036 hits if floored: 0.067%
Probability of not seeing 152+ in 3036 hits if not floored: 1.25 * 10^-5
Conclusions that can be drawn:
Max primary pDif cannot be 2.4
Max primary pDif can only be 2.391 if damage is floored, but at the moment seems the less likely of the available options. (Another 3000 samples would drop probability limit to under 20%.)
Otherwise max primary pDif must be 2.375; however cannot determine whether or not it's floored from this data set.
If we assume that 151 is the true max, the we can also infer that the primary multiplier max cannot be higher than 2.3770 (2 + 386/1024). And from Masa's data it has to be at least 2.373 (2 + 382/1024). Therefore the primary max multiplier at 2.0 cRatio is almost certainly 2.375 (2 + 384/1024).
Probability of not getting a 37 in 2.2k samples with the above setup if damage is not floored is 3.5%. I think that's enough to conclude that the flooring step exists. Originally Posted by Rena
Also, my test data plus Rena's instance of a max crit at 1.625 cRatio pretty much solidifies +0.375 as the cap value to add for max pDif.
On the other end, we got one instance of a value of 95. That requires a pDif between 1.55738 and 1.57377. Given the rarity, it's probably quite close to the upper end. 1.5625 (2 - 448/1024) would predict 3 instances in 3036 samples (probability of 0.00100). Confidence interval of 1 in 3036 with this sample size could allow for up to 6.4 instances in 3036 samples, so 1.5625 is within the confidence interval. A 1.55 min pDif would predict 13.4 instances, which is well outside the confidence interval.
As such, the minimum pDif is almost certainly higher than 1.55. 1.5625 is quite possible, but it could conceivably go as high as 2 - 440/1024 (1.5703125). That seems like a somewhat unlikely number, though.
Edit: moved the distribution graph to the next post. Incorporated some crit damage calculations in this one.
Crit damage:
Continuing from the above data just to see if anything can be gleaned from it, looking at min crit value.
Min crit seen was 160, which means a pDif of between 2.62295 and 2.63934. That's between +638/1024 and +654/1024. It does not match 1 + min non-crit pDif (1.5625).
Relative to 1 + cRatio (1 + 2.0 = 3), it's -0.36066 to -0.37705, or -370/1024 to -386/1024. It's conceivable it might be using the familiar -384/1024 (-0.375).
-
2012-01-15 17:42 #58Chram
- Join Date
- Sep 2007
- Posts
- 2,526
- BG Level
- 7
- FFXI Server
- Fenrir
Here's a graph of the probability distribution for non-crits:
http://img692.imageshack.us/img692/4...t20cratiou.png
You can see the familiar difference in average frequency between the lower half and the upper half. Average frequency for damage values 100 through 121 (so past the 1.05 spread of the lowest range) is 56.3; average for damage values 122 through 144 (so not including the trailing 1.05 spread) is 63.5. Overall it's a 53:47 split.
pDif Distribution:
Overall average crit pDif was 2.974, 0.875% below 3.0.
Frequency of sub-3.0 and 3.0+ is 364 to 564, giving 3.0+ 60.8% of all crits.
With the 1.05 secondary spread, and accounting for flooring, approximately 15% of all points that originally landed below 3.0 would be pushed above 3.0.
If evenly distributed, the area of the lower half (0.4375) should have 16.67% more points than the upper half (0.375), with a balance of 53.85% to 46.15%.
If you shift 15% of 53.85% to the upper half, you end up with 45.77% to 54.23% for the lower and upper half, respectively.
If we take the observed imbalance in the non-crits, with an average frequency difference of 53:47, and apply it to the crit range:
53% of all points land in 0.375.
47% of all points land in 0.4375, and 15% of those are shifted to the upper half by the secondary spread.
Thus: 39.95% of all points land in the lower half, and 60.05% land in the upper half.
That's very close to matching the observed split of 60.8%/39.2%.
It would appear that two factors were implemented to compensate for the damage spread factor. Implemented on its own, the 1.05 secondary multiplier would increase all damage by 2.5%. So, they created an imbalance in the upper and lower half of the distribution to bring the average back close to cRatio. Unfortunately that imbalance was a bit too large, so they added an additional weight that favored the upper half of the pDif range.
Overall result is something that's very close to, but not exactly, an average pDif equal to cRatio.
-
2012-01-16 10:45 #59Chram
- Join Date
- Sep 2007
- Posts
- 2,526
- BG Level
- 7
- FFXI Server
- Fenrir
Min crit from the collection of data points from my and Masa's test data seems to be flatly linear relative to cRatio, between +0.6230 and +0.6303 relative to cRatio (between 638/1024 and 645/1024).
That continues to support the idea indicating that min crit is -0.375 from the cRatio+1 line. cRatio + 1 - 0.375 = cRatio + 0.625 (640/1024).
Other evidence continues to support the idea that a crit is cRatio + 1, which we can define as the term critRatio. As such, we can say that min critRatio is critRatio - 0.375.
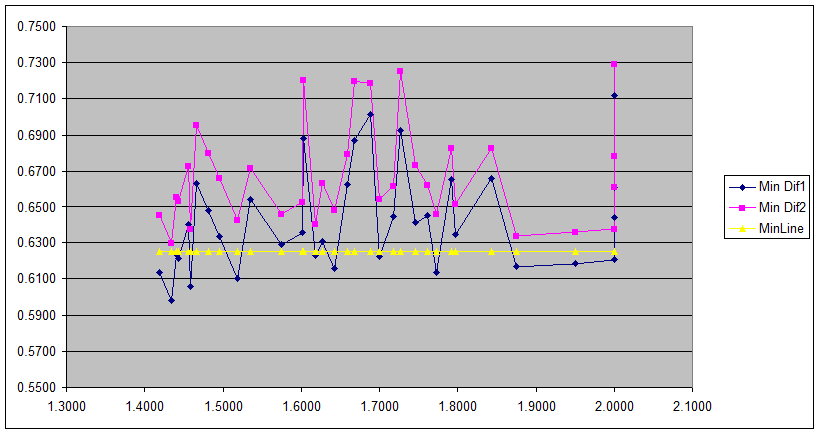
On the max crit side, it's a bit messier. Here's what I did.
First, plot max crit pDif range. As expected, this shows us approximately where max crit is hitting its cap. The highest cRatio we want to consider is ~1.625.
Next, plot the range of valid pDifs for max values relative to cRatio. Could have also been relative to critRatio, but this is what I already had in the spreadsheet. This shows us that max crit appears to be a flat offset.
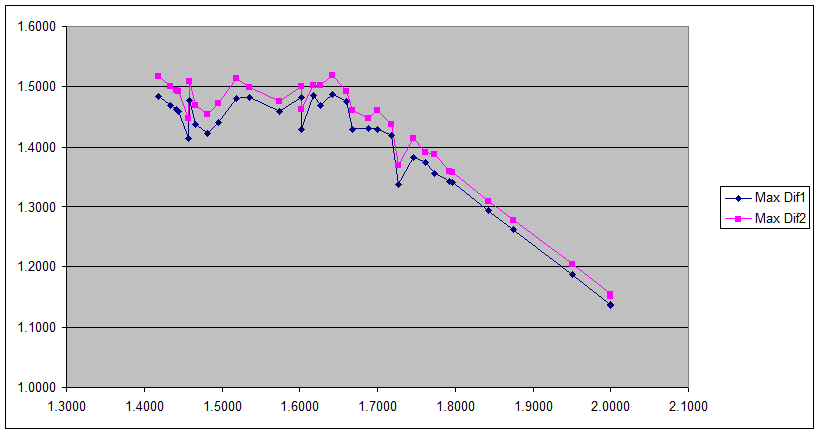
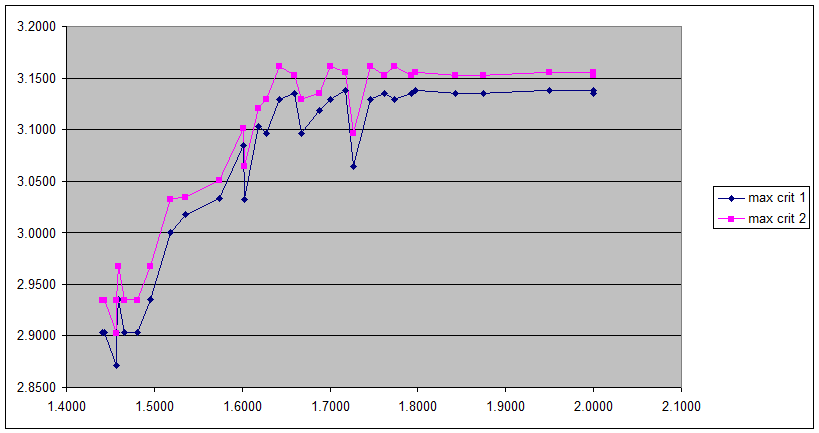
Next we need to figure out what the primary max crit was. We know that there's a flooring step between primary and secondary multipliers, so we can pick values that we know can validly generate the numbers seen.
Here's the chart of confirmation steps:
This confirms that the ceiling values are valid for the max damage seen. So next we want a new set of max pDif values (relative to critRatio) for these calculated max primary damage values.Code:Base D Max D Max/1.05 Ceil Ceil*1.05 Diff 31 90 85.71428571 86 90.3 0.3 31 90 85.71428571 86 90.3 0.3 31 90 85.71428571 86 90.3 0.3 31 90 85.71428571 86 90.3 0.3 31 89 84.76190476 85 89.25 0.25 31 91 86.66666667 87 91.35 0.35 31 90 85.71428571 86 90.3 0.3 31 90 85.71428571 86 90.3 0.3 31 91 86.66666667 87 91.35 0.35 31 93 88.57142857 89 93.45 0.45 58 175 166.6666667 167 175.35 0.35 59 179 170.4761905 171 179.55 0.55 59 182 173.3333333 174 182.7 0.7 31 94 89.52380952 90 94.5 0.5 58 180 171.4285714 172 180.6 0.6 31 96 91.42857143 92 96.6 0.6
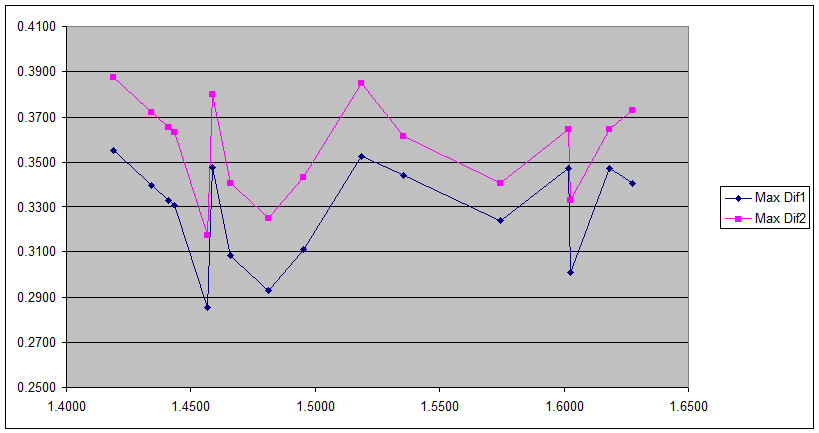
Min valid value would be 0.3552 (+364/1024). Max appears to be 0.3613 (+370/1024), however all of these are subject to low sample sizes, so max could conceivably be as high as 0.3800 (+389/1024).
Given that Rena observed a fully max crit at 1.625 cRatio, it seems likely that max crit is generally critRatio + 0.375, nicely mirroring min crit. A couple large sample sets at less than 1.6 cRatio would be needed to really help confirm it, though.
-
2012-01-16 10:56 #60Chram
- Join Date
- Sep 2007
- Posts
- 2,526
- BG Level
- 7
- FFXI Server
- Fenrir
Additional note on secondary spread:
Max crit damage from my d61 test was 192. We can thus verify that, assuming calculations are done in /1024 units, the secondary multiplier range has to be 0-51, not 0-50.
50/1024 = 0.048828125
3 * (1 + 0.048828125) = 3.146484375
3.146484375 * 61 = 191.935546875, floored to 191
51/1024 = 0.0498046875
3 * (1 + 0.0498046875) = 3.1494140625
3.1494140625 * 61 = 192.1142578125, floored to 192

 Reply With Quote
