 XI Wiki


Not really, they had 7 LBers in camp, and they weren't going to carry that many on the roster. Given, Edds isn't Karlos Dansby or Burnett...but that doesn't make him bad. I think he can be a good LBer on passing downs.
- Navigation
Results 321 to 340 of 2595
-
2011-09-06 21:33 #321The Optimistic Asshole

Sweaty Dick Punching Enthusiast
- Join Date
- Aug 2005
- Posts
- 29,698
- BG Level
- 10
- FFXIV Character
- Tyche Six
- FFXIV Server
- Tonberry

-
2011-09-06 22:16 #322Straight Ca$h Homie
- Join Date
- Dec 2005
- Posts
- 10,937
- BG Level
- 9
 i'm predicting a breakout year for all of our backups
 Originally Posted by Penthesilea

SUPERBOWL BABY
-
2011-09-06 22:17 #323GATTACA!
Sweaty Dick Punching Enthusiast
- Join Date
- Dec 2009
- Posts
- 25,823
- BG Level
- 10
Not without Jonathan Goff. No way. Originally Posted by Deejay
-
2011-09-06 22:24 #324Straight Ca$h Homie
- Join Date
- Dec 2005
- Posts
- 10,937
- BG Level
- 9
Goff had a shit year last season anyway. I really wanted the Giants to pick up a veteran like Burnett because I was never high on the guy. Reports say Kawika Mitchell might be available and I think he'd be a decent stop gap until next season. We did win a superbowl with him and he was a beast in the blitz when he was here.
Edit:
Our defense will pull through all of these losses. I am convinced of it.
All I'm really worried about is whether Eli can shoulder an entire offense without Steve Smith/Kevin Boss. If he can do it, we're winning another championship.
BOOK IT
-
2011-09-06 23:16 #325If I screw up again Im gone forever.
Secret Admin
- Join Date
- Jul 2008
- Posts
- 8,540
- BG Level
- 8
- FFXI Server
- Bismarck
Implying Eli could shoulder an entire offense with those 2 on the team.
-
2011-09-06 23:17 #326The Optimistic Asshole
Sweaty Dick Punching Enthusiast
- Join Date
- Aug 2005
- Posts
- 29,698
- BG Level
- 10
- FFXIV Character
- Tyche Six
- FFXIV Server
- Tonberry
FOOTBALL OUTSIDERS: Innovative Statistics, Intelligent Analysis | 2011 DVOA Projections
http://www.footballoutsiders.com/dvo...oa-projections
2011 DVOA Projections
by Aaron Schatz
The time has come for our annual preseason DVOA projections, updated from the projections that gave us the season forecasts in Football Outsiders Almanac 2011. There has been some movement up and down, although based on projected wins, our projected playoff teams remain the same as in the book. The Pittsburgh win projection is still way, way ahead of everyone else. That's what happens when you combine the best DVOA projection with the second-easiest projected schedule.
We must start with the requisite link to an explanation of DVOA. For anyone new to our site, DVOA stands for Defense-adjusted Value Over Average and measures a team's performance on every play of the season compared to league average in the same situation, adjusted for opponent. I know a lot of people are coming here from various message boards and this is just going to look like a jumble of pointless numbers. Trust me, there is a method to the madness, and over the past ten seasons past DVOA ratings -- as well as these multivariable-based DVOA projections -- have been a far more accurate predictor of future performance than wins or points.
Offense, defense, and special teams DVOA are all projected separately using a system based on looking at trends for teams over the past decade. The equations include a number of variables based on performance over the past two seasons in different splits (by down, passing vs. rushing, red zone vs. whole field) plus variables based on recent draft history, injury history, offensive and defensive pace, coaching experience, quarterback experience, and even weather. Strength of schedule was then figured based on the average projected total DVOA of all 16 opponents for 2011.
The projections here are updated from Football Outsiders Almanac 2011 based on changes in some of the variables, usually related to injuries, offensive line continuity, and quarterback experience. There are no manual adjustments after the fact, although there are manual adjustments because some of the personnel-related variables can be somewhat subjective. For example, there are variables based on mean or median age of projected starters, but we have to decide for some teams whether "projected starters" incorporates a fullback, two tight ends, or three wide receivers. Here's a look at the teams which have seen major movement since the book, and why:
- A number of teams decline on offense due to upheaval on the offensive line, including Philadelphia, Dallas, and Cleveland.
- Oakland, on the other hand, improves because they now plan on starting a more experienced offensive line than originally projected.
- Washington improves on offense because Rex Grossman has more experience and a better "quarterback with no team variables" projection than John Beck.
- General changes in projected starters move the Green Bay and St. Louis defensive projections up.
The numbers we are presenting here are exactly what the projection system spit out. As we say every year: "A few of them will look strange to you. A few of them look strange to us." Tomorrow on the site, we'll be running our usual staff subjective projections where we all talk about where we think the projections are wrong. (I'll give you one of mine right now: Dallas.)
You will notice that offensive projections come out in a wider range than defensive projections, primarily because offense performance tends to be easier to predict (and more consistent from year to year) than defensive performance. In addition, the average projection for the entire league is higher than the 0% DVOA "average" because the offensive environment in the league has been so strong in recent years when compared to the entire period used to construct the DVOA baselines.
(Speaking of which, for those of you who follow the intricate details of DVOA design: Behind the scenes this season I'll be working on a new normalized version of DVOA that's going to set things so every year averages 0% again. It turns out this is slightly better for projecting future performance, but we didn't want to start the gigantic project during the offseason with the knowledge that the lockout could end at any time and require us to stop what we were doing to finish the book.)
The first postseason odds report of the 2011 season is also online. The playoff odds report comes out with different win projections than the equation that we use based on the DVOA of each unit, the strength of schedule, and the balance between offense and defense. The method for the postseason odds report plays out the season game by game rather than looking at all 16 games together, and also includes a variable to account for road games with dome or warm-weather teams visiting cold-weather cities after November 1. I've printed both win totals on the table below. The postseason odds report generally projects win totals close to 8-8 for most teams. I suppose going through and playing each game individually, it seems greater chances for upsets. I'd like to do further research on why the equation and the simulation end up with different results, but to be honest, this is pretty much the worst year possible to try to do any kind of serious analysis in the preseason. The domino effect from the lockout still has me behind on a hundred different things, so I'm more focused on making sure we get all the articles, play-by-play breakdown, and game charting scheduled correctly for the first week. Just remember to take the two different win projections into account if you feel like putting down money on "Pittsburgh over 13."
Those of you who believe Hope Springs Eternal will note that every team has at least a six percent odds of making the playoffs, and no team in the NFC is below 10 percent.
Projected division champions are colored in light yellow. Projected wild card teams are colored in light blue.
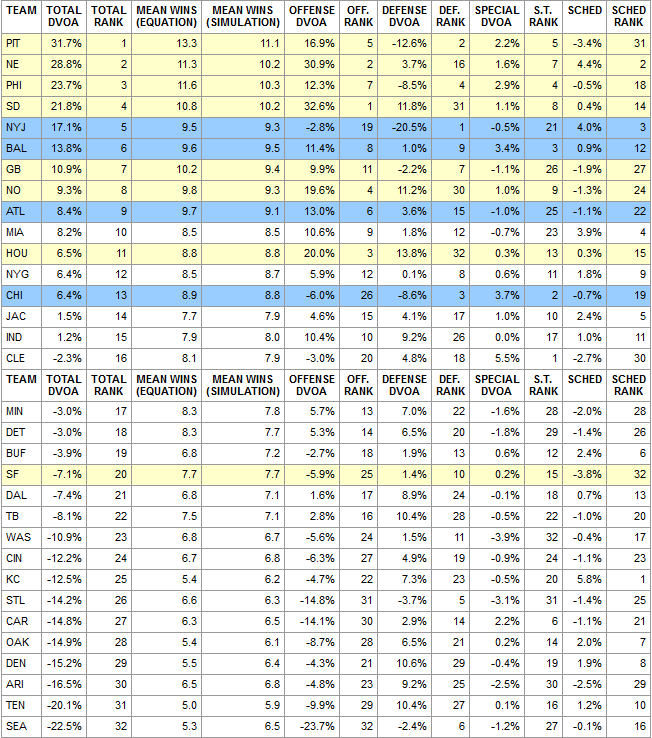
The Colts projection listed above assumes that Peyton Manning will come back and start most of the 2011 season. If we replace Manning with Kerry Collins as Colts quarterback, the Colts' offensive projection changes to -3.6%, which would rank 21st in the league. They would be projected for 5.9 wins, and the projections for Houston, Jacksonville, and Tennessee would all go up by about half a win.
UPDATE 3:30pm: OK, so what do we do now that Jacksonville has cut quarterback David Garrard? Actually, Luke McCown doesn't change the projection much. There's not much to go on, but the record he does have playing with the Jaguars offense is actually positive, so he comes out as basically average, not much worse than Garrard. So the Jacksonville projection with McCown drops only slightly, to 2.3% offensive DVOA. They drop from 7.7 mean wins (in the equation) to 7.4 mean wins. We're not going to bother re-running playoff odds with this change until after Week 1 games.
-
2011-09-06 23:44 #327
- Join Date
- Jul 2006
- Posts
- 6,936
- BG Level
- 8
why is gb so low on that list?
-
2011-09-06 23:46 #328Demosthenes11Guest
11.3 win projection with the second hardest schedule in the nfl? only when you are the pats
-
2011-09-06 23:46 #329Demosthenes11Guest
site is so fucked it keeps double posting ffff
-
2011-09-06 23:47 #330I would prefer not to.
Moms Spaghetti
Philly Special
- Join Date
- May 2006
- Posts
- 39,102
- BG Level
- 10
according to those numbers, eagles will have a top 5 defense this year
eagles will not have a top 5 defense this year.
i am bad at being a homer
-
2011-09-06 23:56 #331Banned.

- Join Date
- Oct 2006
- Posts
- 10,115
- BG Level
- 9

SF wins division? that right there should be enough proof that shit is made by a woman.
-
2011-09-06 23:57 #332If I screw up again Im gone forever.
Secret Admin
- Join Date
- Jul 2008
- Posts
- 8,540
- BG Level
- 8
- FFXI Server
- Bismarck
that thing predicted a 7 win season when the cowboys won 11 games. lolok.
-
2011-09-06 23:58 #333The Optimistic Asshole
Sweaty Dick Punching Enthusiast
- Join Date
- Aug 2005
- Posts
- 29,698
- BG Level
- 10
- FFXIV Character
- Tyche Six
- FFXIV Server
- Tonberry
Would anyone be surprised if any of those teams won that division with a .500 record?
-
2011-09-06 23:58 #334I would prefer not to.
Moms Spaghetti
Philly Special
- Join Date
- May 2006
- Posts
- 39,102
- BG Level
- 10
anyone can win the nfc west with 7 wins, with them playing each other 6 times why nawt
(i dont think they will win either, kolberrin time)
edit: curses, tyche'd
-
2011-09-06 23:59 #335The Optimistic Asshole
Sweaty Dick Punching Enthusiast
- Join Date
- Aug 2005
- Posts
- 29,698
- BG Level
- 10
- FFXIV Character
- Tyche Six
- FFXIV Server
- Tonberry
Originally Posted by Silentleroy
Also predicted the Chargers going from 4-12 to 12-4. If the site got them all right, I'm pretty sure it wouldn't exist and the guy would be working in vegas.
-
2011-09-07 00:00 #336THIS IS BREGOR'S STORY
Beard +1
- Join Date
- Feb 2007
- Posts
- 23,089
- BG Level
- 10
- FFXI Server
- Bahamut

Cleveland, #1 in something! lolspecialteams
PHIL DAWSON
-
2011-09-07 00:15 #337Bring on the Revolution
- Join Date
- Jun 2007
- Posts
- 21,061
- BG Level
- 10
Originally Posted by Bregor
-
2011-09-07 00:23 #338THIS IS BREGOR'S STORY
Beard +1
- Join Date
- Feb 2007
- Posts
- 23,089
- BG Level
- 10
- FFXI Server
- Bahamut
Nice Comic Sans.
-
2011-09-07 00:24 #339Bring on the Revolution
- Join Date
- Jun 2007
- Posts
- 21,061
- BG Level
- 10
the best for the best
-
2011-09-07 00:39 #340I'll change yer fuckin rate you derivative piece of shit
- Join Date
- Sep 2006
- Posts
- 58,707
- BG Level
- 10
Our defense isn't going to be that good this year. Originally Posted by Xajii


Similar Threads
-
NFL Week 2: The NFC South has 3 top 15 teams and the universe revolves around Tom Brady
By Tyche in forum SportsReplies: 1875Last Post: 2011-09-21, 20:37 -
NFL Week 9: It's half way gone. Let's look back and laugh.
By Tyche in forum SportsReplies: 1192Last Post: 2010-11-10, 17:09 -
NFL week 8: No more monkey business. Miz seagulls week 8.
By Mizango in forum SportsReplies: 39Last Post: 2009-10-28, 15:58 -
National Oval throwing ball league: week 17 - Senoska is a weeaboo (NFL week 17)
By Tyche in forum SportsReplies: 635Last Post: 2008-12-31, 12:43 -
NFL week 16...And we still have no Superbowl favorite.
By Tyche in forum SportsReplies: 919Last Post: 2008-12-23, 18:29 -
NFL Week 2...The Beginning Is The End Is The Beginning
By Tyche in forum SportsReplies: 725Last Post: 2008-09-17, 17:53 -
NFL Week 15 Picks *What color is NYJ blood?*
By Tyche in forum SportsReplies: 186Last Post: 2007-12-19, 11:56