 XI Wiki

Not sure if ah transactions is a great indicator given the amount of npcing or direct player to player transactions it seems rmts do
- Navigation
Results 1821 to 1840 of 2261
Thread: Salvage Bans v 2.0


-
2015-05-20 14:54 #1821Ridill

- Join Date
- Apr 2011
- Posts
- 23,594
- BG Level
- 10
- FFXI Server
- Bahamut

-
2015-05-20 16:14 #1822Working as intended.
- Join Date
- Mar 2014
- Posts
- 248
- BG Level
- 4
- FFXI Server
- Bahamut
 Nothing's going to be accurate aside from an official statement from SE. This is basically the Treasure Hunter debate. Similarly, both are worth discussing because people don't want to lose their accounts...and everyone likes Treasure Hunter.
 Originally Posted by dasva

Addendum: I haven't checked this since the release of Alluvion Yorcia, but one thing that was once very popular on Bahamut was mage-burning Outer Ra'Kaznaar Skirmish with RoE gear worn by characters with unpronounceable names. At the time, +2 stones were selling rapidly at a decent price and had an unbelievable stock.
-
2015-05-20 16:25 #1823Ridill
- Join Date
- Oct 2006
- Posts
- 18,369
- BG Level
- 9
- FFXIV Character
- Sath Fenrir
- FFXIV Server
- Cactuar
- FFXI Server
- Fenrir
Been a while since someone besides Ramzus called me Seth, lol.
-
2015-05-20 16:30 #1824Ridill
- Join Date
- Apr 2011
- Posts
- 23,594
- BG Level
- 10
- FFXI Server
- Bahamut
True to an extent. I'm just saying this one is particularly bad considering for a few reasons and SE has given us numbers so what's the point of even speculating on how ffxiah does things when we know it wont be meaningful about bans?
-
2015-05-20 16:43 #1825Working as intended.
- Join Date
- Mar 2014
- Posts
- 248
- BG Level
- 4
- FFXI Server
- Bahamut
At the time I made these estimations about April, Enoch hadn't made me aware of SE's numbers. That's the only reason. Originally Posted by dasva
There really is no point, but I just felt like investigating the matter a bit on behalf of those who got nailed with bans and those a bit worried about coming back.
It's funny. You just told me this an hour after I postponed my appointment with the eye doctor. Oh the irony... Originally Posted by SathFenrir
-
2015-05-20 17:50 #1826RIDE ARMOR
- Join Date
- Apr 2015
- Posts
- 20
- BG Level
- 1
- FFXI Server
- Fenrir
I was asking if you went to the wiki page and read this:
The linear approximation is obtained by dropping the remainder:
f(x) \approx f(a) + f'(a)(x - a).
Before you wrote this:
Every time I read your posts, it seems like you are less concerned with helping people understand your methods and more concerned with proving how many pretty math terms you know, evidenced by your mention of Taylor Series in that last wall of text. Originally Posted by Sephiran
Also,
This:
equals this: Originally Posted by Montag
I am aware that taking the linear approximation of of line is pretty redundant, which is why I would just straight up take the derivative. Originally Posted by Sephiran
-
2015-05-20 17:55 #1827E. Body
- Join Date
- Jun 2011
- Posts
- 2,031
- BG Level
- 7
- FFXI Server
- Odin

 They have it in TOU: Originally Posted by Byrthnoth
Spoiler: show
-
2015-05-20 17:56 #1828RIDE ARMOR
- Join Date
- Apr 2015
- Posts
- 20
- BG Level
- 1
- FFXI Server
- Fenrir
That is to say those tangent lines just aren't the same. They are clearly 2 separate lines...
-
2015-05-20 18:10 #1829
1) The data has no reason to be linear and it isn't linear or logarithmic, so there's no reason to fit a line to it (or log scale it). If you wanted to approximate the number of people banned in a shifted subquarterly window, you should use interpolation. If you want to use it for something else, put down the keyboard and walk away because you're drunk.
2) There's no reason to believe that the current bans that this thread is about are being handled by the STF. They're the "Special Task Force" created to handle RMT related issues, not the only people that can ban.
3) The error bars on the original PRISM plot of the data were divinely inspired. Every point is absolute. This gets to me because I've seen it so often in science presentations and papers.
-
2015-05-20 18:29 #1830Working as intended.
- Join Date
- Mar 2014
- Posts
- 248
- BG Level
- 4
- FFXI Server
- Bahamut
I like your affinity towards the Wiki wall of text, but where's the problem? Linear approximations of the form you listed yield the tangent lines at a. The slopes of both lines are the same. I just made a correction to the original post. Is that the ambiguity you were referring to? Originally Posted by Montag
-
2015-05-20 18:34 #1831Ridill
- Join Date
- Oct 2006
- Posts
- 18,369
- BG Level
- 9
- FFXIV Character
- Sath Fenrir
- FFXIV Server
- Cactuar
- FFXI Server
- Fenrir
Salvage Bans v 2.0
Tl;dr of the past few pages:
Linear fits to polynomial data, not even once.
Really though, any method of basic polynomial interpolation would've been more (by a lot) appropriate. For any data that can be approximated by a function of the form f(x) = x^n + x^(n-1) ... + c, with n>1, a linear fit is not appropriate or correct.
Once n>=2 it starts to become a deadly sin in the applied math world to talk about linear fits.
This data, however presented, is at the least n=3.
Source: The Bible. https://people.maths.ox.ac.uk/trefethen/ATAP/
-
2015-05-20 19:10 #1832Working as intended.
- Join Date
- Mar 2014
- Posts
- 248
- BG Level
- 4
- FFXI Server
- Bahamut
Which data? The one I made the picture of or the one from FFXIAH? The one I made the picture of was f(x) = (x-3)(x+3)(x+2). That was just to demonstrate the slopes of the tangent lines remaining the same. The FFXIAH DB data is nowhere near as "interesting" in the November to March interval as a polynomial function of degree 3 or higher. I literally just chose that for aesthetics in the demonstration. In the actual FFXIAH DB data, the number of characters who disappeared each day was within 50~100 of those that disappeared the previous day. It was, within an acceptable margin a linear decrease over that interval. If the data from FFXIAH looked any different, I would have used a polynomial regression. The whole reason I even brought calculus and linear approximations into this was to show that the dead servers would make no difference in an analysis of the rate of change of accounts banned per month. Originally Posted by SathFenrir
Anywho, I will check out that link. The majority of my math experience so far is on the comp. sci. end--which is in discrete math, calculus, digital logic, and its ilk. My statistical prowess is, at the time, limited to regression analysis and some other tools afforded by linear algebra.
-
2015-05-20 19:24 #1833Ridill
- Join Date
- Oct 2006
- Posts
- 18,369
- BG Level
- 9
- FFXIV Character
- Sath Fenrir
- FFXIV Server
- Cactuar
- FFXI Server
- Fenrir
Salvage Bans v 2.0
Dont fit lines to data purely for aesthetics.
That shit's for people with marketing degrees and made to be read by people with no degrees.
-
2015-05-20 19:40 #1834Working as intended.
- Join Date
- Mar 2014
- Posts
- 248
- BG Level
- 4
- FFXI Server
- Bahamut
Hence the reason I put up the demonstration in the first place. It wasn't intended for you, Byrth, or Montag. It was intended for the people earlier who said that the dead servers were influencing the rates of change. Are there any further ambiguities I should correct or clarify? Originally Posted by SathFenrir
For you Byrth, I made this. This is the ban data from SE. Unfortunately, I did not have time to make a monthly scale, but despite the appearance, this is a list plot. In the first you have a linear-linear plot. On the second you have a linear-logarithmic plot. The only reason to do this is to make views of data with exponential change more manageable.(Though I'm sure you already know this, the plot of y=10^x will look a straight line in lin-log plotting.) In this case, I believe a lin-log plot helps capture the grand scheme of things a bit better.
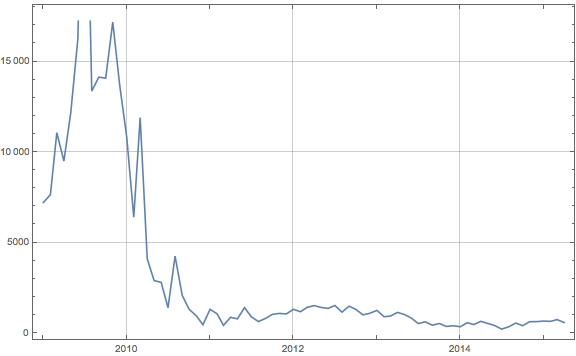
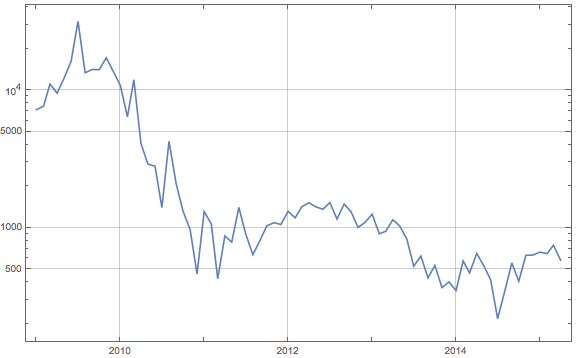
-
2015-05-20 21:02 #1835Banned.

- Join Date
- Jan 2009
- Posts
- 3,872
- BG Level
- 7
- FFXI Server
- Shiva
- WoW Realm
- Kil'jaeden
so essentially what you're saying is, it isn't tapering off at all, you were completely and utterly wrong on that point.
also people brought up the dead servers for a reason, one that i have said several times but you don't seem to grasp at all so i will say it again. even though some random moderator/whatever at ffxiah(before this it was a random 5 year old post on allakhazam) told you what he believes to be how the database is derived, you don't know for sure. the numbers on dead servers may just be a bug, but it's possible that the number on dead servers is also derived from some other formula that is used to deduct the number of characters that it's outputting, it could also be increased based on a formula to make the game look more active than it is. that is why it still is not something that should be being used to deduct anything at all, end of discussion. no idea why you continue to use it and ignore this point but whatever, this is the 4th or 5th time i've said this and you just come back and say "but so and so" yeah that's inconclusive unfortunately
-
2015-05-20 21:20 #1836Working as intended.
- Join Date
- Mar 2014
- Posts
- 248
- BG Level
- 4
- FFXI Server
- Bahamut
That's an email from the people who run FFXIAH. Why would they lie? How can there still be discrepancies over how the data is determined? Originally Posted by D44kpunk
Though yes, you are correct about the tapering. I can't say for certain about tapering any more. As soon as the free login campaign started, all bets were off about making predictions past early April using my method. While I did call that correctly, someone pointed out that the margin was pretty slim, so I can't really call that a victory or a correct call.
But I'll get to work on something else though using the official SE stats. The bad part about the official stats from SE is the lengthy sample interval (one month).
-
2015-05-20 23:34 #1837Ridill
- Join Date
- Oct 2006
- Posts
- 18,369
- BG Level
- 9
- FFXIV Character
- Sath Fenrir
- FFXIV Server
- Cactuar
- FFXI Server
- Fenrir
Salvage Bans v 2.0
If you want better data you have the power. Do a separate test of 3-4-5 times per day ranging from beginning of your playtime to end. Do a /sea all, record numbers, plot 5 data points/day for weeks/months.
It's one server but I'd bet a large amount of money that at this point the behavior of one server = the behavior of any server (+\-10%).
Doesn't even matter that you don't get JP time or whatever. You will be measuring gradual trends in a statistically relevant sample size. Provided you measure consistently enough and with enough data points it will be 100000x more valuable than SE data, AH data, etc, and you'll have your own confidence intervals and error bars.
If you want to do science (which is exactly what analyzing data trends falls under) this is how you do science. Anything else is half-assing data you can't corroborate.
And yes, some will be mules, that doesn't actually matter. If you gather enough data, even if only half the people logged in are real players your trends will be real and measurable, provided there is any noticeable change in player population.
-
2015-05-21 01:24 #1838Old Odin
- Join Date
- Oct 2006
- Posts
- 6,198
- BG Level
- 8
- FFXI Server
- Asura
 yeah about the bolded part, Asura seems to have quiet an impact on returning players and onplayers (especially GMT) swaping servers, because so many GMT players swaped from other servers to here (me included), also reddit Originally Posted by SathFenrir
-
2015-05-21 02:42 #1839Working as intended.
- Join Date
- Mar 2014
- Posts
- 248
- BG Level
- 4
- FFXI Server
- Bahamut
Oh bother. It looks like Damane beat me to the punch on that one. No matter, I'll take sloppy seconds with Bahamut. Bahamut is (like Odin) one of the more populated servers and has a comparatively high Japanese population. In all honesty, I can't see a generalization based on Odin, Asura, or Bahamut being an accurate reflector. Again though, no stats we get on this matter are perfect. I can sit at my keyboard in Mathematica and make graphs 'til my fingers fall off (been a while since I had Carpal Tunnel Syndrome), but that won't please everybody. I can only do the best I can within an acceptable margin. Originally Posted by Damane
I think you're speaking to banality of try to gather any sort of data about an online game from the player standpoint. Indeed I can try these things, but you just listed the assumptions (and thus distortions) that would affect the data I collect. Regardless, when school ends and I'm back home, I'll it to the newly created Mathematica "Ban Notebook". I'll even put it up on Wolfram Cloud so you can criticize my work and have me scramble to fix it. (In all honesty, had you and Montag not spoken up earlier, I wouldn't have found the mis-titling of linear approximation in one of my older posts. I credited you both in the "posted edited" comment.) Originally Posted by SathFenrir
Anyway, since I already made Byrth pretty graphs, I guess I should give you presents too. Firstly, to assert the fact that I do indeed know about polynomial regression and when to use it, I made the graph on SE's ban data. The wild and not-at-all consistent nature of the data since 2009 makes this most suitable to a polynomial curve. However, I will admit I'm unfamiliar with error margins (aside from those determined by best-fit regressions from linear algebra) and confidence intervals. So...who knows? I'm out of my comfort zone now so this all could be wildly inaccurate. Both graphs are polynomial regressions of the form [IMG]http://www.bluegartr.com/ .
.
SE Numbers in lin-lin scale: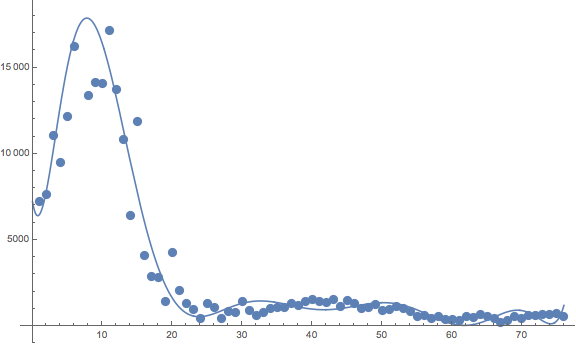
SE Numbers in lin-log scale: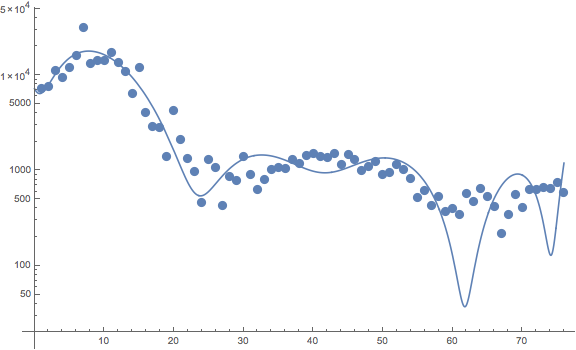
My apologies that neither have dates on them. Each unit does represent one month though and has all the data in SE's table. For the record, I do not condone attempting to glean meaningful information from these graphs. I just don't want people to think I don't know when to use a polynomial regression and when linear approximation and extrapolation are inappropriate.
-
2015-05-21 04:19 #1840New Spam Forum
- Join Date
- Sep 2014
- Posts
- 184
- BG Level
- 3
if you're worried people will perceive you as ignorant, perhaps the best option would be to stop posting about this


Similar Threads
-
i got banned from bg forum once
By Judah in forum FFXI: EverythingReplies: 9Last Post: 2005-09-03, 19:26